
Complete research-figure example · synthetic aggregate counts
How do selection counts become an inspectable research flow diagram?
A complete selection-flow example using explicitly synthetic aggregate counts: 1200 assessed records become 850 included records. Download the CSV, methods and figure legend, and editable SVG. This is not a study finding or model run.
Frozen research question
With aggregate exclusion counts recorded in a fixed order, how can you explain each reason, avoid double-counting, and deliver an editable flow diagram with a complete legend?
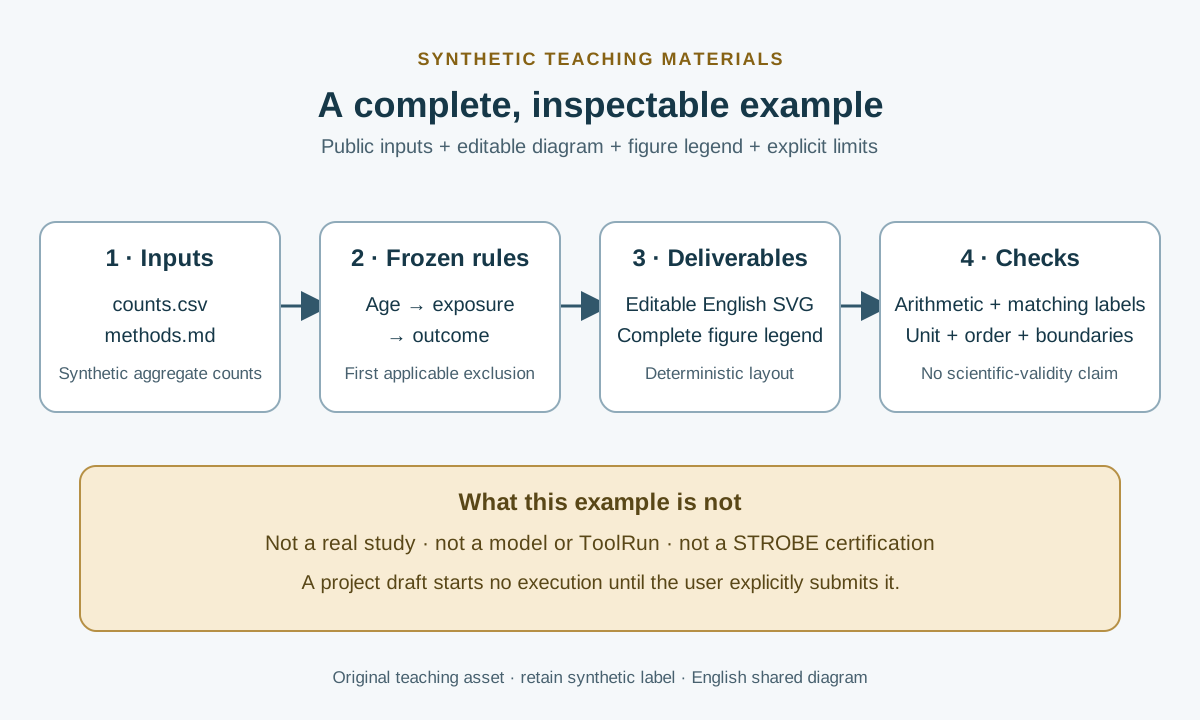
Example process
What steps does this example include?
- 01
Inspect counts.csv and methods.md, confirm that the unit is a record, and retain the synthetic-data label.
- 02
Freeze the order: age below 18 years, missing exposure, then missing outcome. Assign a record to its first applicable reason only.
- 03
Subtract 120, 80 and 150 from 1200 sequentially; check intermediate totals of 1080 and 1000 and the final 850.
- 04
Lay out an editable SVG with remaining counts on the main line and exclusions on side branches; write the unit, order, counts and teaching boundary into the legend.
- 05
Match the table, diagram, legend and page. When reusing the inputs, edit the new project draft first; execution starts only after explicit user submission.
Main result
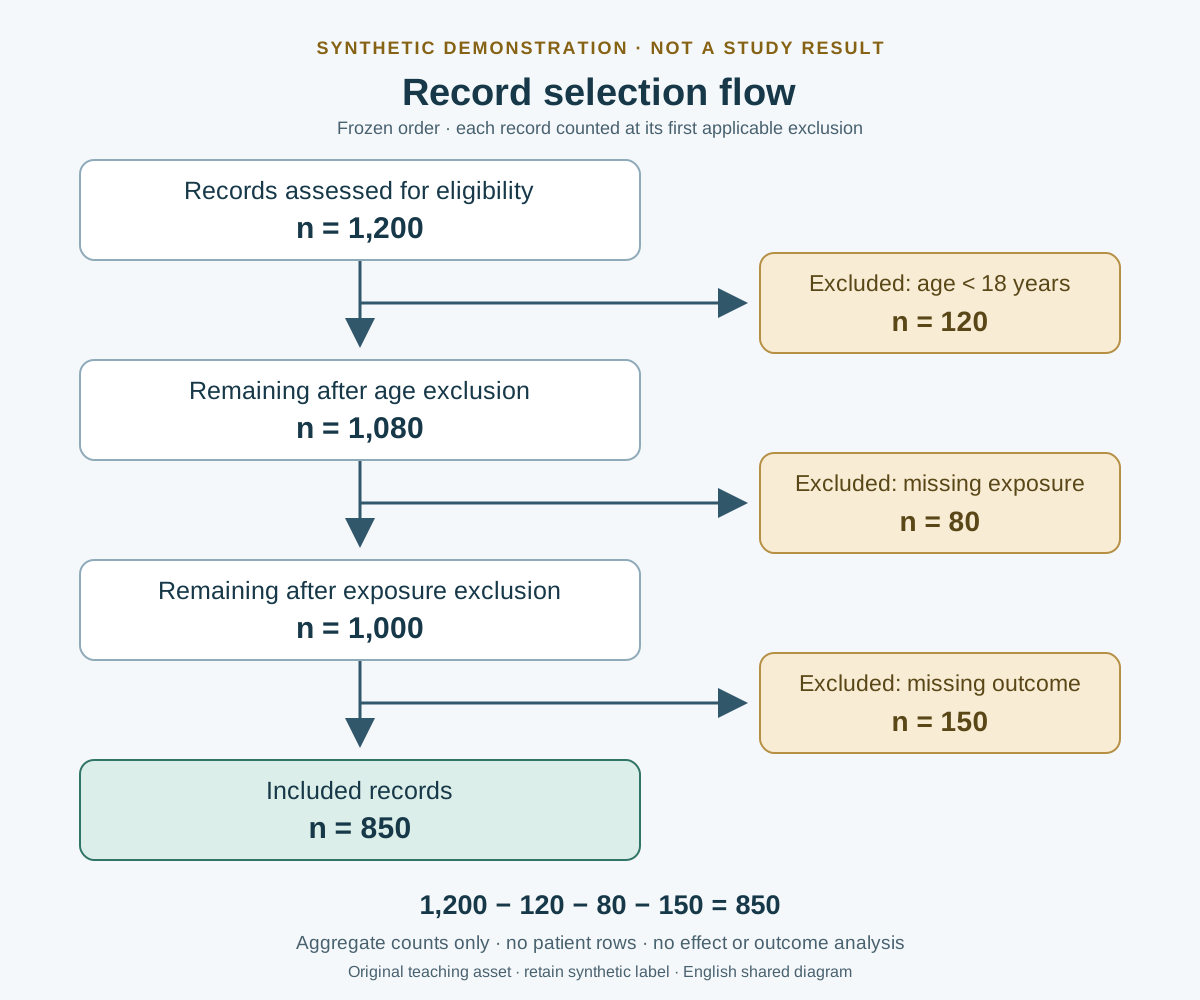
Complete output: 850 synthetic records in the final box
- Excluded for age below 18
- 120
- Excluded for missing exposure
- 80
- Excluded for missing outcome
- 150
- Included records
- 850
Excluded from 1200 starting records, leaving 1080
Excluded from the remaining 1080, leaving 1000
Excluded from the remaining 1000, leaving 850
1200 − 120 − 80 − 150 = 850
This example answers how aggregate counts can become an editable, inspectable selection diagram. It does not analyse exposure and outcome or report an effect, confidence interval or p-value. The final 850 is a synthetic remainder under frozen rules, not a research finding.
Why must the input specify order and unit?
The 1200 starting records are assessed for eligibility, not asserted to meet every final rule. First exclude 120 for age below 18; then exclude 80 for missing exposure from the remaining records; finally exclude 150 for missing outcome. The reasons are mutually exclusive by sequential allocation, not because their underlying characteristics cannot overlap.
An aggregate table cannot verify deduplication, individual overlap or application of the rules. Relabelling records as patients requires a source definition and deduplication evidence. Changing the order may change category counts in a real dataset, and this input cannot recalculate that change.
The output is more than an image
The CSV exposes each input, excluded and remaining count. The Markdown includes frozen rules, a complete legend, method reference, limitations and reuse conditions. The SVG retains editable text, shapes and arrows. They share one set of numbers, with no hidden dataset or unavailable reproduction package.
A complete legend states that 1200 records undergo exclusions of 120 for age below 18, 80 for missing exposure and 150 for missing outcome, leaving 850. Each record belongs to its first applicable reason and all counts are synthetic teaching values. The original files and shared SVGs are in English; translating the page does not translate downloaded files.
Do not confuse correct arithmetic with scientific validity
Check 1200−120=1080, 1080−80=1000, 1000−150=850, and 1200−120−80−150=850. Then inspect units, branch reasons, arrow order and the legend. These checks establish internal consistency only, not source accuracy, ethical approval or research validity.
Excluding missing values here is an illustration, not a general recommendation for complete-case analysis. A real project needs its source, dates, population, missing-data justification and relevant study stages. This diagram cannot estimate selection bias or support causal, treatment or submission claims. STROBE item 13 is a reporting reference, not certification or full checklist compliance.
Reuse it without inventing a study
Download and edit the materials, or reference the two English inputs and editable question in a new project draft. Keep the synthetic warning, revise the objective for your question, and provide lawful, authorised material appropriate to the task. Do not treat the demonstration counts as observed data or publish patient-level values.
Referencing files prepares a draft; it does not start a model, research tool or paid task. Execution requires an explicit user submission. This page simulates no production Run and promises no guaranteed completion. The newly created synthetic materials may be downloaded and adapted for your own teaching or research workflow drafts, retaining the synthetic label. This permission excludes STROBE's website, logo, checklists and other third-party material.
Demonstration materials
What materials are recorded in this example?
- Complete synthetic counts.csv input, with every exclusion and remaining count
- English methods.md with rules, methods, full legend, limits and bounded reuse conditions
- Editable English flow.svg with the main sequence and exclusion branches
- English preparation diagram and complete localized page, not model-generated execution outputs
Downloaded files retain their original language. Check each material’s language and purpose notes.
Synthetic count input CSV
English original, 514 bytes; aggregate record counts only, reusable as project input.
counts.csv · 514 BMethods and complete figure legend
English original, 5731 bytes; includes sequential allocation, limits and bounded reuse conditions.
methods.md · 5731 BEditable flow-diagram SVG
Shared English output, 3612 bytes; download and edit, not automatically referenced as an input.
flow.svg · 3612 B
Quality checks
Software checks do not mean submission-ready
- The input, diagram, legend and page use the same counts; checks cover internal arithmetic and label consistency.
- Each exclusion is taken from the remaining set, rather than adding independent totals for overlapping characteristics.
- No patient-level data, identifiers, statistical effects or publication-readiness score are included.
- Deterministic preparation is not presented as human peer review, STROBE certification or a real platform run.
Public-use boundaries
How should this example not be interpreted?
- All counts are synthetic demonstrations, not observed data or research findings.
- Aggregate counts cannot verify real deduplication, overlapping exclusions, source accuracy or execution.
- Missing-value exclusion is a teaching rule, not a universal missing-data strategy.
- No causal, treatment, ethical, clinical or submission-permission conclusion is provided.
- Page text is fully localized; downloadable materials and shared SVGs remain in English.
- This is not a production user conversation, model call or ToolRun; a referenced draft is not successful execution.
Sources
Verified sources
- STROBE official checklistsChecked 2026-10-10; item 13 is a reporting reference for stage counts and flow diagrams, not certification of this example.
- STROBE official websiteBackground on the reporting initiative; it supplies no synthetic counts and endorses no study quality here.
Complete research-figure example · synthetic aggregate counts